


The raging golden bull market

Contributed by Kingsley Jones
The recent correction in precious metals prices, and the sharp reaction in share prices for the gold miners, has presented an interesting investment opportunity. Normally, investors prefer those miners with lower costs of production. This protects profits against a fluctuating gold price. However, there is a trade-off between that and the size of the in-ground reserve and number of operations.
In this note, we make the case for buying the tier-one majors, especially Newmont.
As we show, the demand for gold changed after the Global Financial Crisis (GFC) in 2008. Central banks switched from being consistent net sellers of gold to consistent net buyers. After the uplift in gold prices, the global gold mining industry has not raised production significantly since 2018. These factors have contributed to the present bull market, which is now accelerated by geopolitical tensions.
Let us check on the blistering pace of the precious metals bull market.
In a year where the headlines waxed lyrical on the future of Artificial Intelligence, and President Trump imposed tariffs on anything that moved, precious metals have stolen the show.
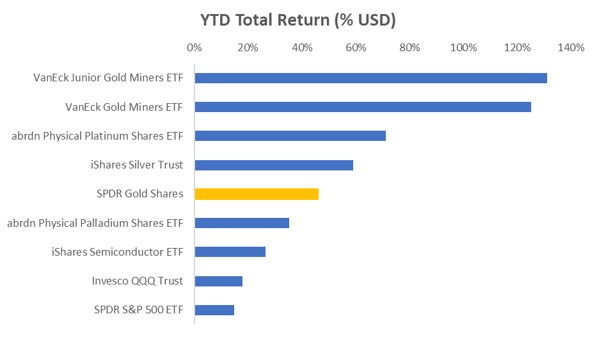
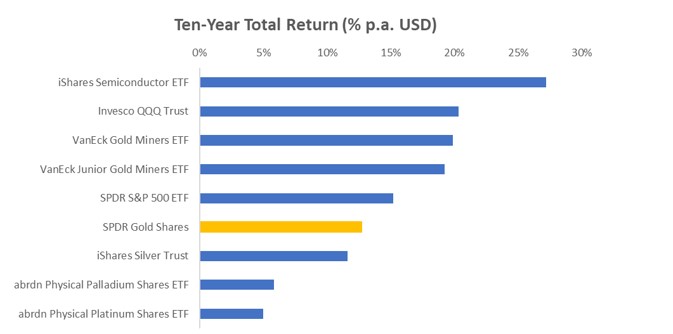
Even hot sectors like semiconductors have fallen in the wake of this raging bull. The league table over ten years is now under threat from an upstart challenge: the Barbarous relic of gold, and friends.
The rise of dollar alternatives
“Whoever has the gold makes the rules.” That old Wizard of Id quip still rings true — especially when you realize there are two kinds of gold: control of the US dollar system and control of global trade.
Since the Bretton Woods Agreement in 1944, the dollar has reigned supreme. It was once pegged to gold — until President Nixon cut the cord on Friday the 13th, August 1971. That unleashed a decade-long gold bull market, fuelled by rampant fiat creation, oil shocks in 1973 and 1979 and global stagflation.
The chaos only cooled when Volcker’s Fed tamed inflation, and the Plaza Accord of 1986 gave the US economy a competitive reset by revaluing the yen.
History doesn’t repeat — but it sure knows how to rhyme.
The US Dollar has been losing appeal as a central bank reserve asset for some time.
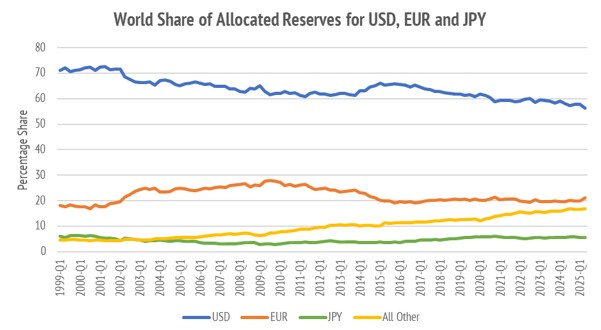
While there is much talk of the threat to US Dollar dominance from China, the data tells a nuanced story. Among the big three currencies, the US Dollar (USD), Euro (EUR) and Japanese Yen (JPY) the loss of reserve share has mainly fallen on the USD, through the rise of other currencies.
One might think that the Chinese Yuan (CNY) has been the culprit in stealing share. A closer look at within the “All Other” category shows a more interesting story. The established reserve currencies, such as the Pound (GBP), Canadian Dollar (CAD), Australian Dollar (AUD) and Swiss Franc (CHF), are comparatively stable, Figure 4. Oddly enough, it is all the other currencies that stole market share.
Note that this reserve currency data excludes gold holdings.
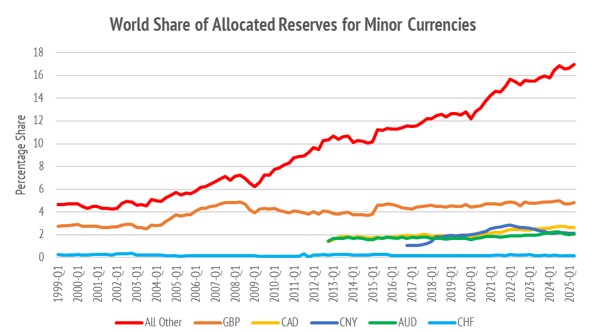
What appears to be driving this is the gradual shift of global trade to encompass a wider variety of global currencies. Global central banks are holding more of these, and hence fewer dollars.
The change in central bank behaviour
Related to the above there has been a profound change in central bank’s buying of gold.
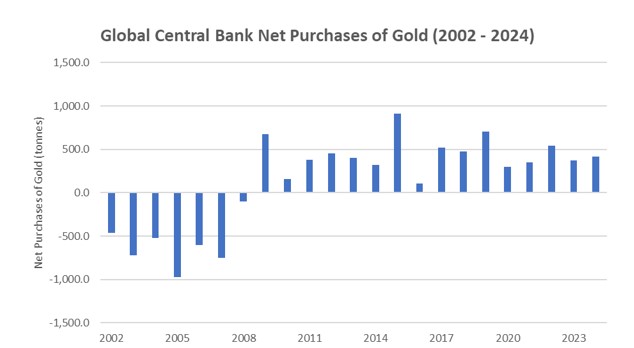
The likely cause of this was the acute global dollar shortage that the 2008 credit squeeze caused. This was addressed by the US Federal Reserve issuing emergency dollar swap lines to rescue global trade.
Had the Federal Reserve not provided emergency dollar credit to support global trade, there would likely have been a global depression. There is no doubt that central banks outside of the US were grateful for this much-needed support. However, the experience was clearly chastening. What seems to have happened is a global de-risking of being overly reliant on one funding currency for trade.
The geopolitics of official gold holdings
The geopolitical tone of our time is increasingly set by the contrast between an anxious group of rich Western nations, and the rising group of everyone else. India and China have the largest populations but are still underrepresented in official gold holdings, especially on a per-capita basis.
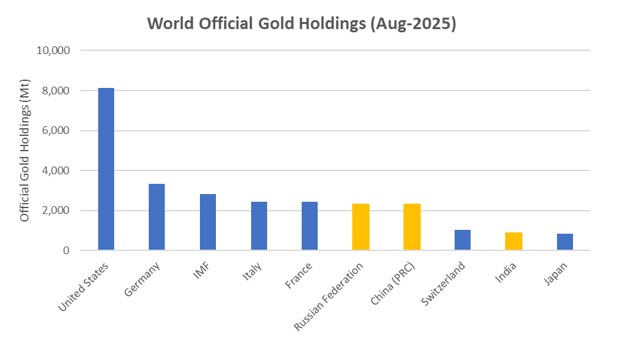
Russia, China and India have been systematically adding to their official gold reserves.
The geopolitics of gold production
The idea of buying gold directly from a potential adversary is not without risk. Cryptocurrency is an alternative reserve asset to gold but depends on the availability of advanced semiconductors. Due to the current restrictions on export of advanced semiconductors and equipment from the West into the nations of China and Russia, cryptocurrency assets are unlikely to be appealing as a reserve asset.
When viewed from a non-Western perspective gold mining looks viable to build up the equivalent of foreign exchange reserves in a world of increased trade restrictions. The Bretton Woods monetary system employed gold reserves as security for financing foreign trade, and to settle accounts.
History is rhyming very loudly on this point.
This gold bull market seems to be more about the creation of an alternative monetary system than it is about the haven appeal of a few gold bars in private vaults. There is a nationalistic dimension, and it looks the same regardless of nationality. Gold is no promise. Hold gold when trust is evaporating.
Importantly, the US and its allies are well placed from a gold mining perspective. It is true that China and Russia are the two largest gold producers, but Australia, Canada and the US follow closely.
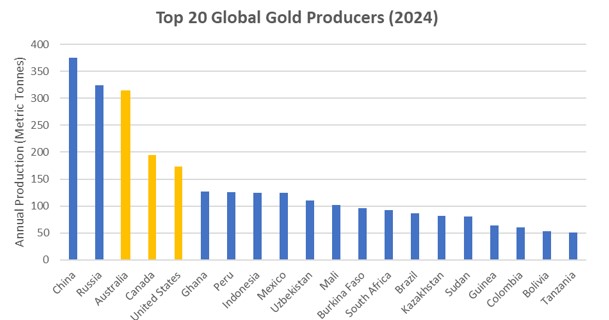
This is doubtless the reason why gold has universal appeal. Most gold production is now occurring in the emerging markets. However, the above-ground reserves, and current production of the Western nations underwrites our own monetary security. This is especially true for North America.
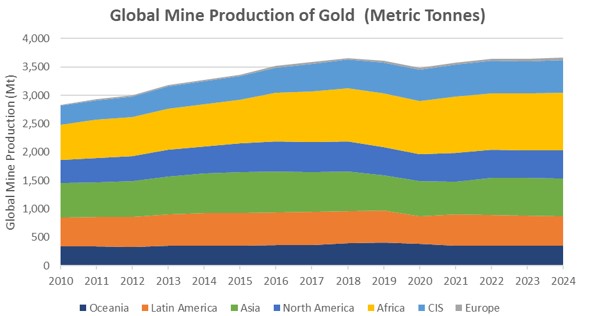
The slow supply response
The current bull market is well supported by a slow supply response from new production.
Price support from (modest) cost inflation
The profitability of new mining operations is driven by the All-In Sustaining Cost (AISC) of mining operations. Historically, the spot gold price has been higher than the average cost of mining.
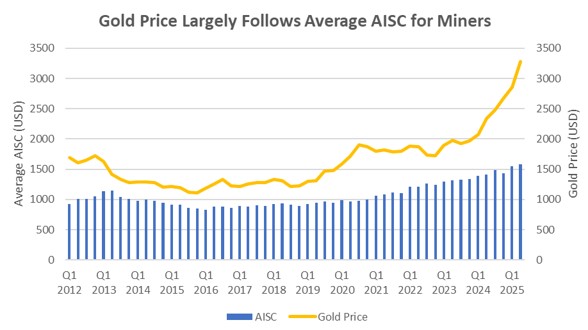
Deducting the average AISC figure from the gold price provides an estimate of margin.
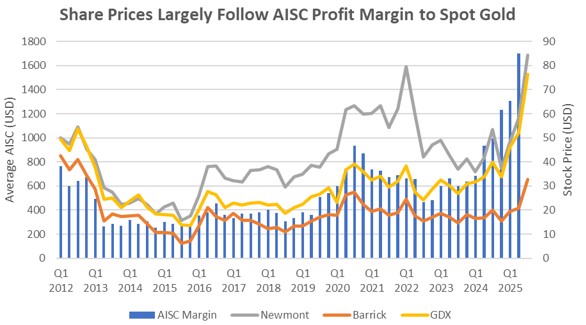
In the above, the share prices of the two largest producers Newmont Mining and Barrick Mining are overlaid along with the VanEck Gold Miners ETF. The recent surge in share prices is supported by the rapid expansion of ASIC margins, and hence profitability.
Investment Opportunity in Gold Mining
The recent pullback in gold prices, and share prices for miners, serves to remind investors of the risks inherent in all investment decisions. However, the deeper story is more profound than seasonal trade of the risk-on, risk-off type. In our view, the global monetary and trade system is changing from one that revolved around fiat-currency finance, with the US Dollar as king, to a more primitive form.
Gold has served mankind as a unit of account, and a store of value, for thousands of years.
What is happening now might well be viewed in that historical framework.
The decline of the US Dollar as a reserve asset has been very gradual. There is no certainty that this process will continue, and no indication that it is accelerating. Equally, the pace of central bank buying seems steady. The one factor which appears to have changed is the balance of supply vs. demand.
Gold production from mines has grown at 1.85% CAGR since 2010.
There is a clear incentive to grow production at these prices, but the response is slow.
It can take ten years or more to bring new discoveries into production.
Seek operating leverage
For many years, the major gold producers, those controlling many mines, with large reserves, were shunned by the market in favour of lower cost producers and nimble explorers and developers. Times may have changed now. The uplift in prices beyond the average cost of mining has created a compelling opportunity in producers with high operating leverage. This term reflects the sensitivity of company profits to rising gold prices. This happens directly from current production but has a profound kicker from the value of gold in the ground. The majors with so-called tier-one assets benefit from leverage more than their smaller and generally lower cost peers. This is the effect we are positioning for.
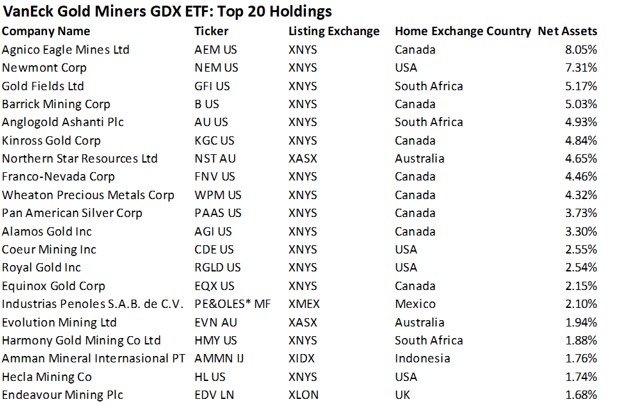
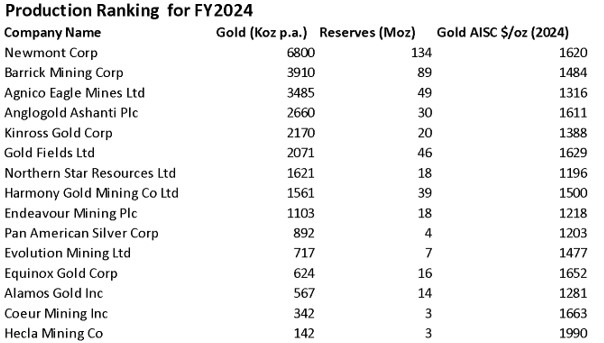
The easiest way to survey this is to start with the top twenty holdings of the GDX ETF, Figure 11. From this table we can construct a production ranking for the last full reporting year of FY2024. Looking at the resulting table, Figure 12, South African producers are generally higher cost. There will likely be a rerating of these, especially those with platinum and palladium exposure, should these prices hold.
The top three Newmont, Barrick Mining and Agnico Mining have a lower risk, due to the spread of global operations, and a clearer focus on the Americas. One needs to consider risks associated with West African operations, especially Barrick which has a dispute with the government in Mali, following a coup in that nation. Newmont operates in the lower risk Ghana.
Investment conclusion
In our view, the recent correction offers a rare opportunity to reposition holdings into those tier-one miners that are likely to benefit from sustained higher gold prices. The spot gold price may well move sideways from here, as the market does look overbought relative to recent history. However, we view this as a multi-year bull market that will be sustained by monetary buying of gold. Production takes time to come on stream, and the incentive pricing is there for the majors to expand profitably.
The key point is to note that margins are now strong enough to support sustained profitability. Due to the long lag in the production system, this is a great time to be buying tier one producers.
Among the stocks covered, we favour the top three producers, but believe Newmont offers an attractive combination of high production, long reserve life, and a keen valuation of 15.8x forward earnings.
Source:
Cashu Research
luca@cashugroup.com
research.cashugroup.com/
